
Page 21 - NIRF 2023
P. 21
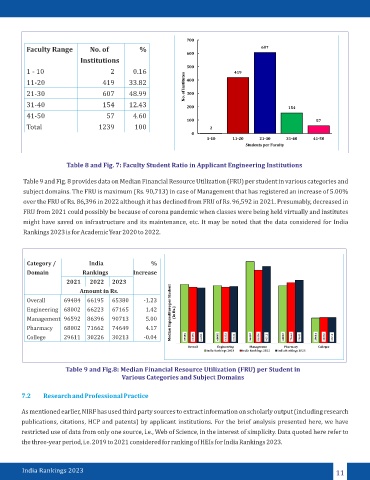
Faculty Range        No. of          %
                            Institutions
          1 - 10                      2      0.16
          11-20                    419      33.82

          21-30                    607      48.99
          31-40                    154      12.43
          41-50                     57       4.60

          Total                   1239        100


                       Table 8 and Fig. 7: Faculty Student Ratio in Applicant Engineering Institutions


         Table 9 and Fig. 8 provides data on Median Financial Resource Utilization (FRU) per student in various categories and
         subject domains. The FRU is maximum (Rs. 90,713) in case of Management that has registered an increase of 5.00%
         over the FRU of Rs. 86,396 in 2022 although it has declined from FRU of Rs. 96,592 in 2021. Presumably, decreased in
         FRU from 2021 could possibly be because of corona pandemic when classes were being held virtually and institutes
         might have saved on infrastructure and its maintenance, etc. It may be noted that the data considered for India
         Rankings 2023 is for Academic Year 2020 to 2022.


          Category /                      India      %
          Domain                    Rankings      Increase
                        2021    2022   2023
                                  Amount in Rs.
          Overall     69484  66195    65380      -1.23
          Engineering  68002  66223   67165      1.42
          Management  96592  86396    90713      5.00
          Pharmacy    68002  71662    74649      4.17
          College     29611  30226    30213      -0.04


                       Table 9 and Fig.8: Median Financial Resource Utilization (FRU) per Student in
                                         Various Categories and Subject Domains


        7.2    Research and Professional Practice

        As mentioned earlier, NIRF has used third party sources to extract information on scholarly output (including research
        publications, citations, HCP and patents) by applicant institutions. For the brief analysis presented here, we have
        restricted use of data from only one source, i.e., Web of Science, in the interest of simplicity. Data quoted here refer to
        the three-year period, i.e. 2019 to 2021 considered for ranking of HEIs for India Rankings 2023.


        India Rankings 2023                                                                                     11