
Page 19 - NIRF 2023
P. 19
It was observed that faculty with doctoral qualification is concentrated in top 100 institutions, remaining institutions
have fewer faculty with doctoral degree. This is a serious handicap since mentorship received during the doctoral
training can play a vital role in preparing the faculty for a teaching career in higher education. Table 5 and Fig. 4 depict
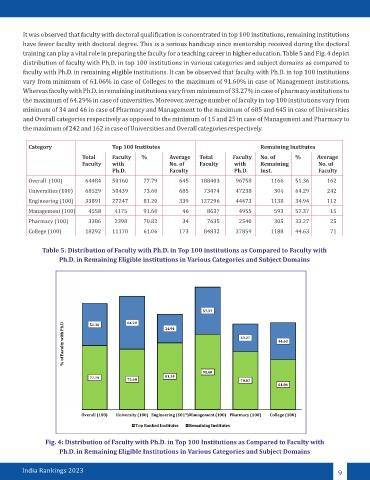
distribution of faculty with Ph.D. in top 100 institutions in various categories and subject domains as compared to
faculty with Ph.D. in remaining eligible institutions. It can be observed that faculty with Ph.D. in top 100 institutions
vary from minimum of 61.06% in case of Colleges to the maximum of 91.60% in case of Management institutions.
Whereas faculty with Ph.D. in remaining institutions vary from minimum of 33.27% in case of pharmacy institutions to
the maximum of 64.29% in case of universities. Moreover, average number of faculty in top 100 institutions vary from
minimum of 34 and 46 in case of Pharmacy and Management to the maximum of 685 and 645 in case of Universities
and Overall categories respectively as opposed to the minimum of 15 and 25 in case of Management and Pharmacy to
the maximum of 242 and 162 in case of Universities and Overall categories respectively.
Category Top 100 Institutes Remaining Institutes
Total Faculty % Average Total Faculty No. of % Average
Faculty with No. of Faculty with Remaining No. of
Ph.D. Faculty Ph.D. Inst. Faculty
Overall (100) 64484 50160 77.79 645 188403 96758 1166 51.36 162
Universities (100) 68529 50439 73.60 685 73474 47238 304 64.29 242
Engineering (100) 33891 27247 81.20 339 127296 44473 1138 34.94 112
Management (100) 4558 4175 91.60 46 8637 4955 593 57.37 15
Pharmacy (100) 3386 2398 70.82 34 7635 2540 305 33.27 25
College (100) 18292 11170 61.06 173 84832 37859 1188 44.63 71
Table 5: Distribution of Faculty with Ph.D. in Top 100 institutions as Compared to Faculty with
Ph.D. in Remaining Eligible institutions in Various Categories and Subject Domains
Fig. 4: Distribution of Faculty with Ph.D. in Top 100 Institutions as Compared to Faculty with
Ph.D. in Remaining Eligible Institutions in Various Categories and Subject Domains
India Rankings 2023 9