
Page 9 - NIRF 2023
P. 9
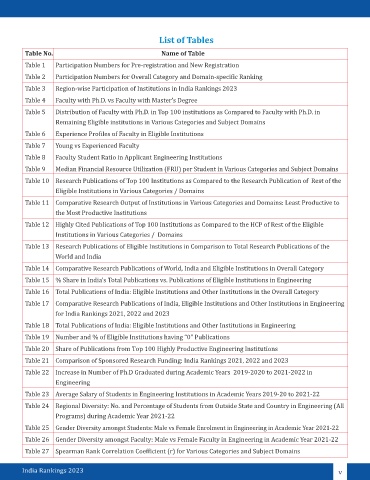
List of Tables

         Table No.                                      Name of Table

         Table 1   Participation Numbers for Pre-registration and New Registration
         Table 2   Participation Numbers for Overall Category and Domain-specific Ranking

         Table 3   Region-wise Participation of Institutions in India Rankings 2023
         Table 4   Faculty with Ph.D. vs Faculty with Master’s Degree
         Table 5   Distribution of Faculty with Ph.D. in Top 100 institutions as Compared to Faculty with Ph.D. in

                   Remaining Eligible institutions in Various Categories and Subject Domains
         Table 6   Experience Profiles of Faculty in Eligible Institutions
         Table 7   Young vs Experienced Faculty

         Table 8   Faculty Student Ratio in Applicant Engineering Institutions
         Table 9   Median Financial Resource Utilization (FRU) per Student in Various Categories and Subject Domains

         Table 10  Research Publications of Top 100 Institutions as Compared to the Research Publication of  Rest of the
                   Eligible Institutions in Various Categories / Domains
         Table 11  Comparative Research Output of Institutions in Various Categories and Domains: Least Productive to
                   the Most Productive Institutions

         Table 12  Highly Cited Publications of Top 100 Institutions as Compared to the HCP of Rest of the Eligible
                   Institutions in Various Categories /  Domains
         Table 13  Research Publications of Eligible Institutions in Comparison to Total Research Publications of the
                   World and India

         Table 14  Comparative Research Publications of World, India and Eligible Institutions in Overall Category
         Table 15  % Share in India’s Total Publications vs. Publications of Eligible Institutions in Engineering

         Table 16  Total Publications of India: Eligible Institutions and Other Institutions in the Overall Category
         Table 17  Comparative Research Publications of India, Eligible Institutions and Other Institutions in Engineering
                   for India Rankings 2021, 2022 and 2023
         Table 18  Total Publications of India: Eligible Institutions and Other Institutions in Engineering

         Table 19  Number and % of Eligible Institutions having “0” Publications
         Table 20  Share of Publications from Top 100 Highly Productive Engineering Institutions

         Table 21  Comparison of Sponsored Research Funding: India Rankings 2021, 2022 and 2023
         Table 22  Increase in Number of Ph.D Graduated during Academic Years  2019-2020 to 2021-2022 in
                   Engineering

         Table 23  Average Salary of Students in Engineering Institutions in Academic Years 2019-20 to 2021-22
         Table 24  Regional Diversity: No. and Percentage of Students from Outside State and Country in Engineering (All
                   Programs) during Academic Year 2021-22

         Table 25  Gender Diversity amongst Students: Male vs Female Enrolment in Engineering in Academic Year 2021-22
         Table 26  Gender Diversity amongst Faculty: Male vs Female Faculty in Engineering in Academic Year 2021-22
         Table 27  Spearman Rank Correlation Coefficient (r) for Various Categories and Subject Domains


        India Rankings 2023                                                                                      v