
Page 8 - NIRF 2023
P. 8
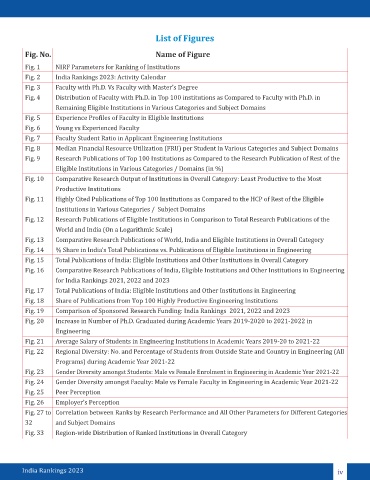
List of Figures

         Fig. No.                                    Name of Figure

         Fig. 1    NIRF Parameters for Ranking of Institutions
         Fig. 2     India Rankings 2023: Activity Calendar
         Fig. 3    Faculty with Ph.D. Vs Faculty with Master’s Degree

         Fig. 4    Distribution of Faculty with Ph.D. in Top 100 institutions as Compared to Faculty with Ph.D. in
                   Remaining Eligible  nstitutions in Various Categories and Subject DomainsI
         Fig. 5    Experience Profiles of Faculty in Eligible Institutions
         Fig. 6    Young vs Experienced Faculty
         Fig. 7    Faculty Student Ratio in Applicant Engineering Institutions
         Fig. 8    Median Financial Resource Utilization (FRU) per Student in Various Categories and Subject Domains
         Fig. 9    Research Publications of Top 100 Institutions as Compared to the Research Publication of  Rest of the
                   Eligible Institutions in Various Categories / Domains (in %)
         Fig. 10   Comparative Research Output of Institutions in Overall Category: Least Productive to the  Most
                   Productive Institutions
         Fig. 11   Highly Cited Publications of Top 100 Institutions as Compared to the HCP of  Rest of the Eligible
                   Institutions in Various Categories /  Subject Domains

         Fig. 12   Research Publications of Eligible Institutions in Comparison to Total Research Publications of the
                   World and India (On a Logarithmic Scale)
         Fig. 13   Comparative Research Publications of World, India and Eligible Institutions in Overall Category
         Fig. 14   % Share in India’s Total Publications vs. Publications of Eligible Institutions in Engineering
         Fig. 15   Total Publications of India: Eligible Institutions and Other Institutions in Overall Category
         Fig. 16   Comparative Research Publications of India, Eligible Institutions and Other Institutions in Engineering
                   for India Rankings 2021, 2022 and 2023
         Fig. 17   Total Publications of India: Eligible Institutions and Other Institutions in Engineering
         Fig. 18   Share of Publications from  op 100 Highly Productive Engineering InstitutionsT

         Fig. 19   Comparison of Sponsored Research Funding: India Rankings  2021, 2022 and 2023
         Fig. 20   Increase in Number of Ph.D. Graduated during Academic Years 2019-2020   2021-2022 in to
                   Engineering
         Fig. 21   Average Salary of Students in Engineering Institutions in Academic Years 201 -9 20  to 2021-22
         Fig. 22   Regional Diversity: No. and Percentage of Students from Outside State and Country in Engineering (All
                   Programs) during Academic Year 2021-22
         Fig. 23   Gender Diversity amongst Students: Male vs Female Enrolment in Engineering in Academic Year 2021-22
         Fig. 24   Gender Diversity amongst Faculty: Male vs Female Faculty in Engineering in Academic Year 2021-22
         Fig. 25   Peer Perception
         Fig. 26   Employer’s Perception
         Fig. 27 to Correlation between Ranks by Research Performance and All Other Parameters for Different Categories
         32        and Subject Domains

         Fig. 33   Region-wide Distribution of Ranked Institutions in Overall Category


        India Rankings 2023                                                                                      iv