
Page 35 - NIRF 2023
P. 35
7.5. Perception
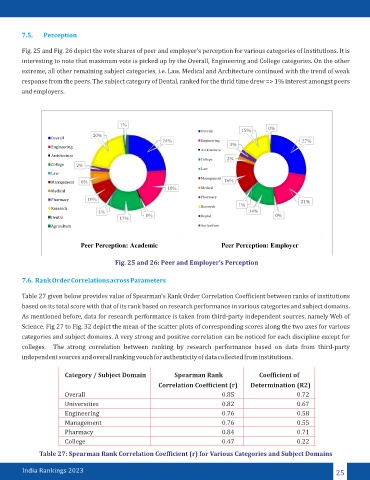
Fig. 25 and Fig. 26 depict the vote shares of peer and employer’s perception for various categories of Institutions. It is
interesting to note that maximum vote is picked up by the Overall, Engineering and College categories. On the other
extreme, all other remaining subject categories, i.e. Law, Medical and Architecture continued with the trend of weak
response from the peers. The subject category of Dental, ranked for the thrid time drew => 1% interest amongst peers
and employers.
Fig. 25 and 26: Peer and Employer’s Perception
7.6. Rank Order Correlations across Parameters
Table 27 given below provides value of Spearman’s Rank Order Correlation Coefficient between ranks of institutions
based on its total score with that of its rank based on research performance in various categories and subject domains.
As mentioned before, data for research performance is taken from third-party independent sources, namely Web of
Science. Fig 27 to Fig. 32 depict the mean of the scatter plots of corresponding scores along the two axes for various
categories and subject domains. A very strong and positive correlation can be noticed for each discipline except for
colleges. The strong correlation between ranking by research performance based on data from third-party
independent sources and overall ranking vouch for authenticity of data collected from institutions.
Category / Subject Domain Spearman Rank Coefficient of
Correlation Coefficient (r) Determination (R2)
Overall 0.85 0.72
Universities 0.82 0.67
Engineering 0.76 0.58
Management 0.76 0.55
Pharmacy 0.84 0.71
College 0.47 0.22
Table 27: Spearman Rank Correlation Coefficient (r) for Various Categories and Subject Domains
India Rankings 2023 25