
Page 33 - NIRF 2023
P. 33
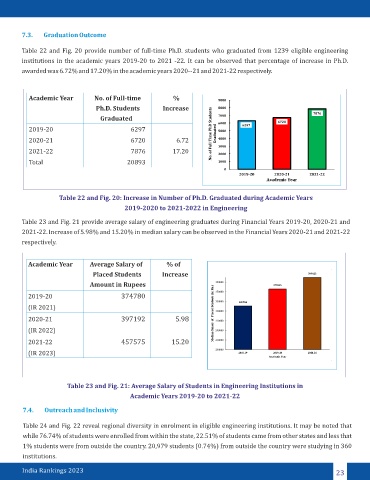
7.3.    Graduation Outcome

        Table 22 and Fig. 20 provide number of full-time Ph.D. students who graduated from 1239 eligible engineering
        institutions in the academic years 2019-20 to 2021 -22. It can be observed that percentage of increase in Ph.D.
        awarded was 6.72% and 17.20% in the academic years 2020--21 and 2021-22 respectively.


           Academic Year          No. of Full-time             %
                                   Ph.D. Students      Increase
                                    Graduated
           2019-20                          6297
           2020-21                          6720           6.72

           2021-22                          7876          17.20
           Total                           20893


                     Table 22 and Fig. 20: Increase in Number of Ph.D. Graduated during Academic Years
                                          2019-2020 to 2021-2022 in Engineering

        Table 23 and Fig. 21 provide average salary of engineering graduates during Financial Years 2019-20, 2020-21 and
        2021-22. Increase of 5.98% and 15.20% in median salary can be observed in the Financial Years 2020-21 and 2021-22
        respectively.


          Academic Year        Average Salary of          % of
                                 Placed Students       Increase
                               Amount in Rupees
          2019-20                        374780

          (IR 2021)
          2020-21                        397192            5.98

          (IR 2022)
          2021-22                        457575           15.20
          (IR 2023)


                       Table 23 and Fig. 21: Average Salary of Students in Engineering Institutions in
                                            Academic Years 2019-20 to 2021-22

         7.4.    Outreach and Inclusivity

         Table 24 and Fig. 22 reveal regional diversity in enrolment in eligible engineering institutions. It may be noted that
         while 76.74% of students were enrolled from within the state, 22.51% of students came from other states and less that
         1% students were from outside the country. 20,979 students (0.74%) from outside the country were studying in 360

         institutions.
        India Rankings 2023                                                                                     23